See Download the extension for macOS/Windows here.
Vscode Plugin
Installation
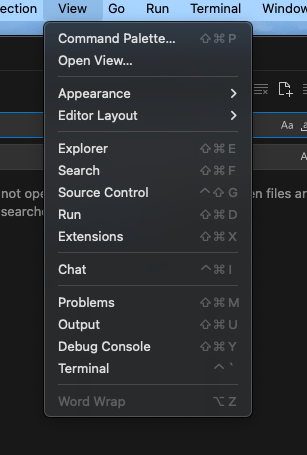
Select View->Extensions
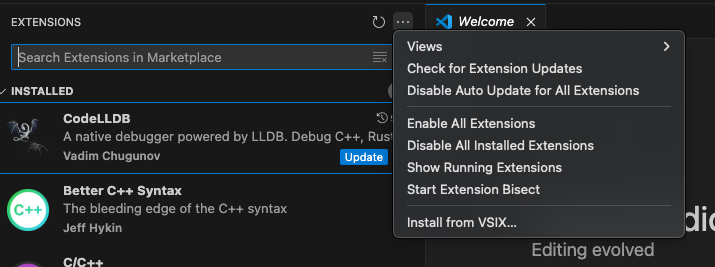
Click on 3 dots to the right and select “Install from VSIX…”
Environment Setup for New Starter
Open a folder in VS Code to use as the root workspace for the Zephyr project.
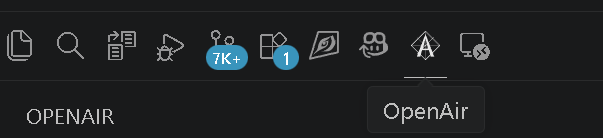
Locate the OpenAir extension in the extension view
In the Setup view, click Zephyr IDE Configuration to check the environment status
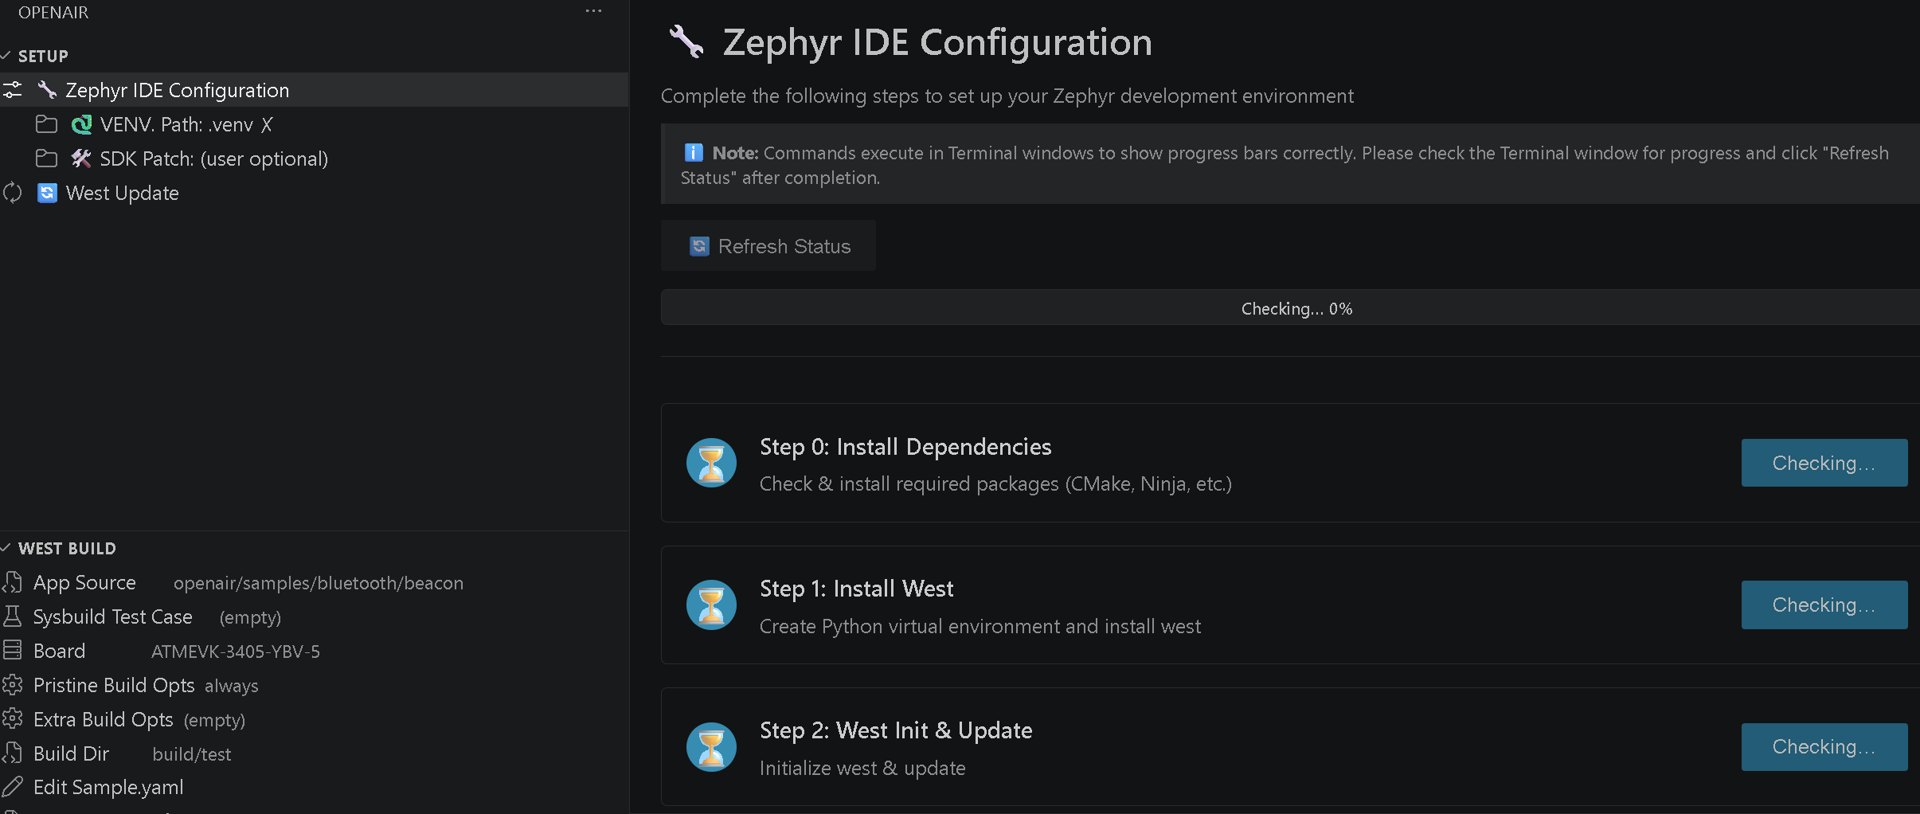
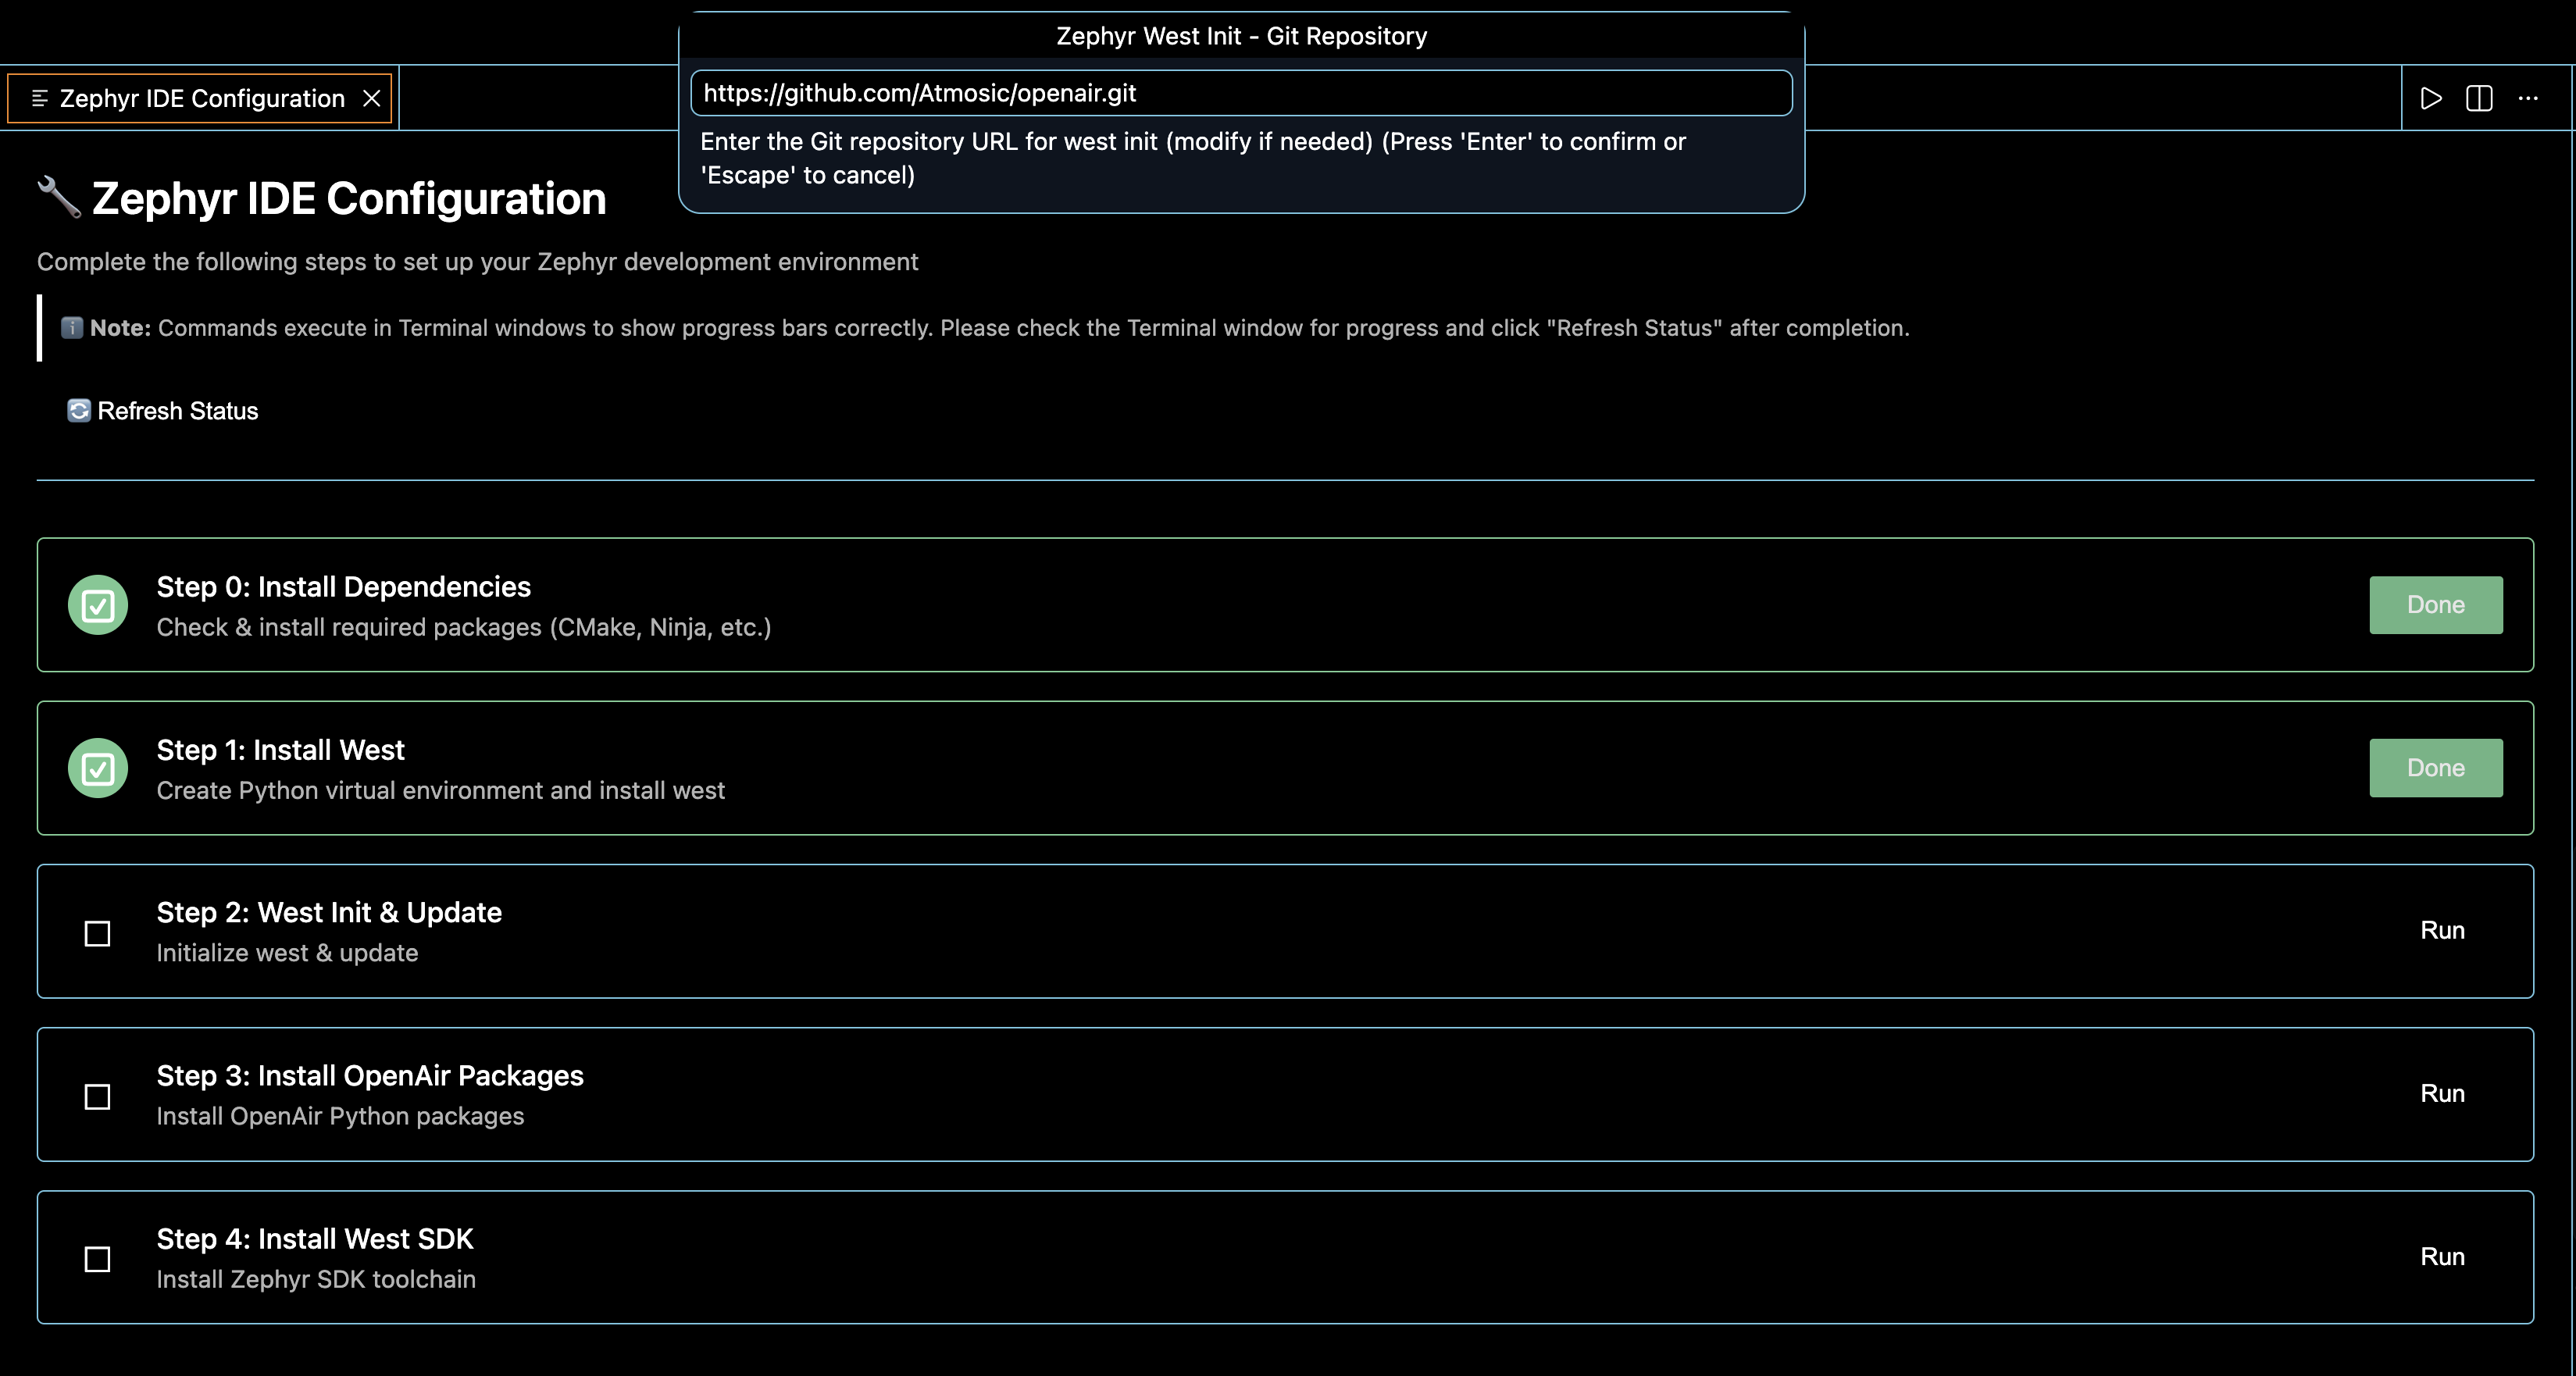
In the Zephyr IDE Configuration, follow the setup steps to prepare the environment for Zephyr development prerequisites.
Note
The time required depends on your internet quality.
Use existing virtual environment
1. Open an existing Zephyr project workspace. You can reuse the existing virtual environment and SDK on your computer by specifying their paths in the Setup view, avoiding the need to repeat earlier steps in Zephyr IDE Configuration.
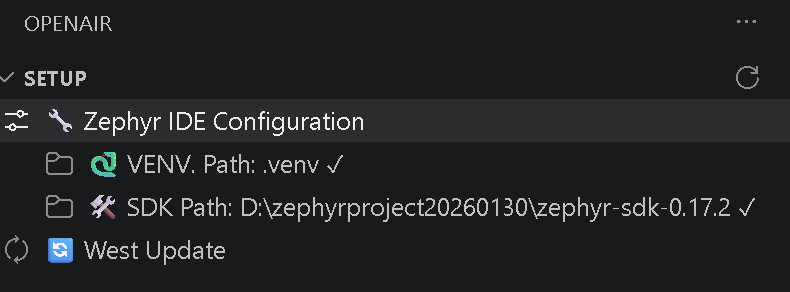
Note
The virtual environment folder must be named .venv for proper integration with the VS Code extension.
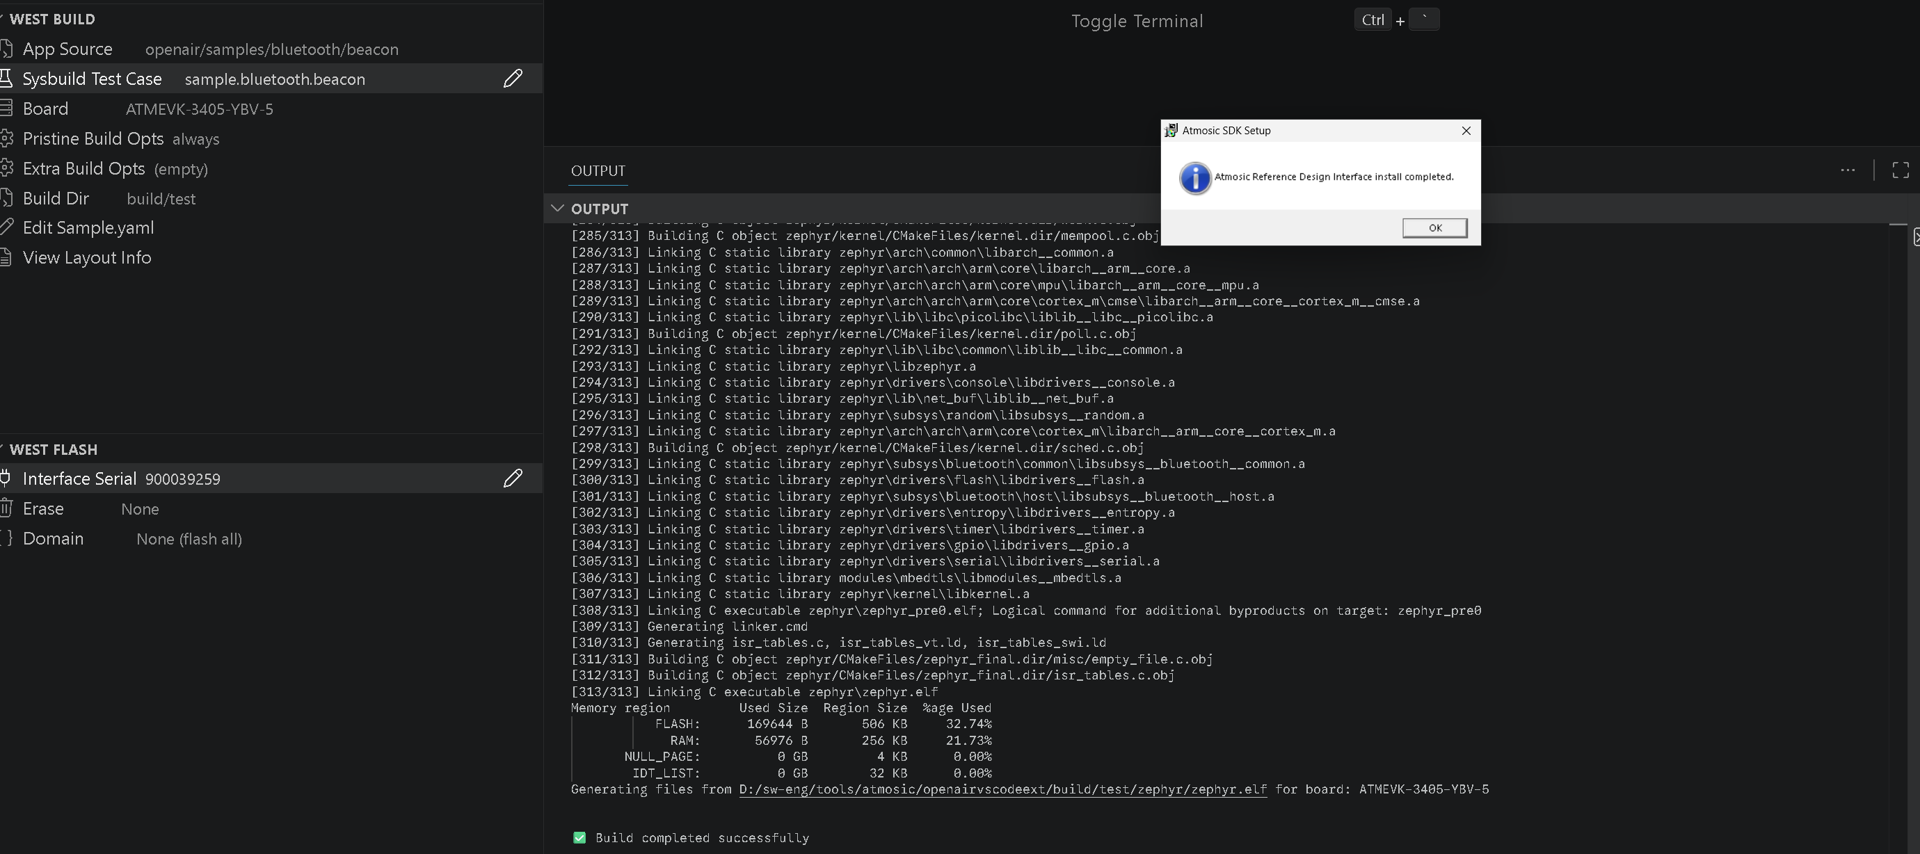
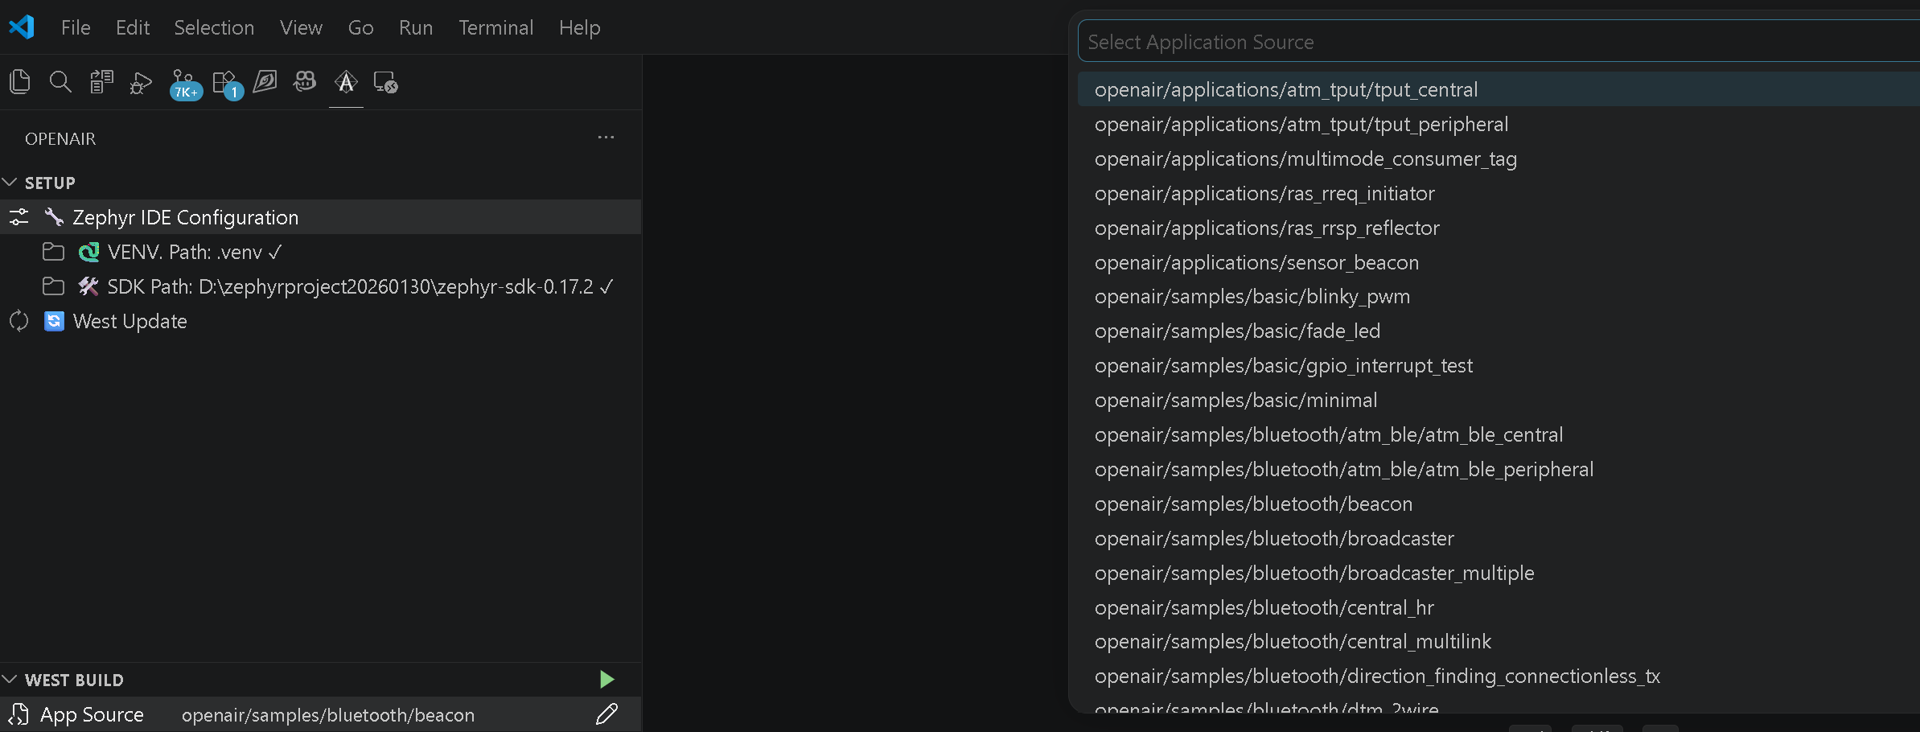
Build OpenAir applications
In the West Build view, select applications supported by OpenAir from “App Source”.
2. Choose from several predefined configurable combinations in Sysbuild Test Case. Boards are also selectable.
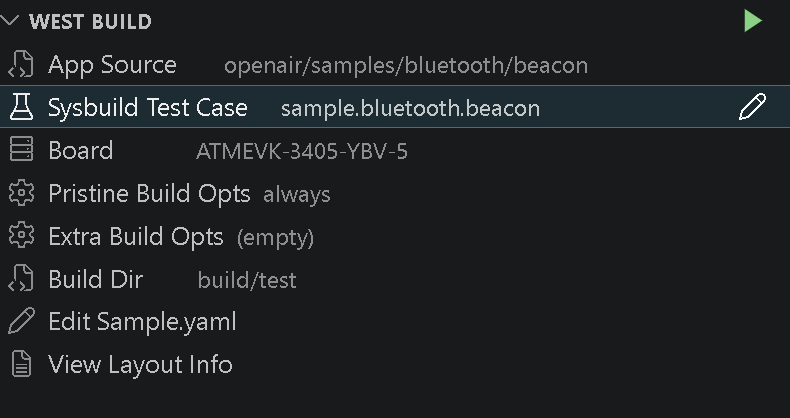
Note
For experienced users, select Pristine Build Opts defined by Zephyr and add Extra Build Opts.
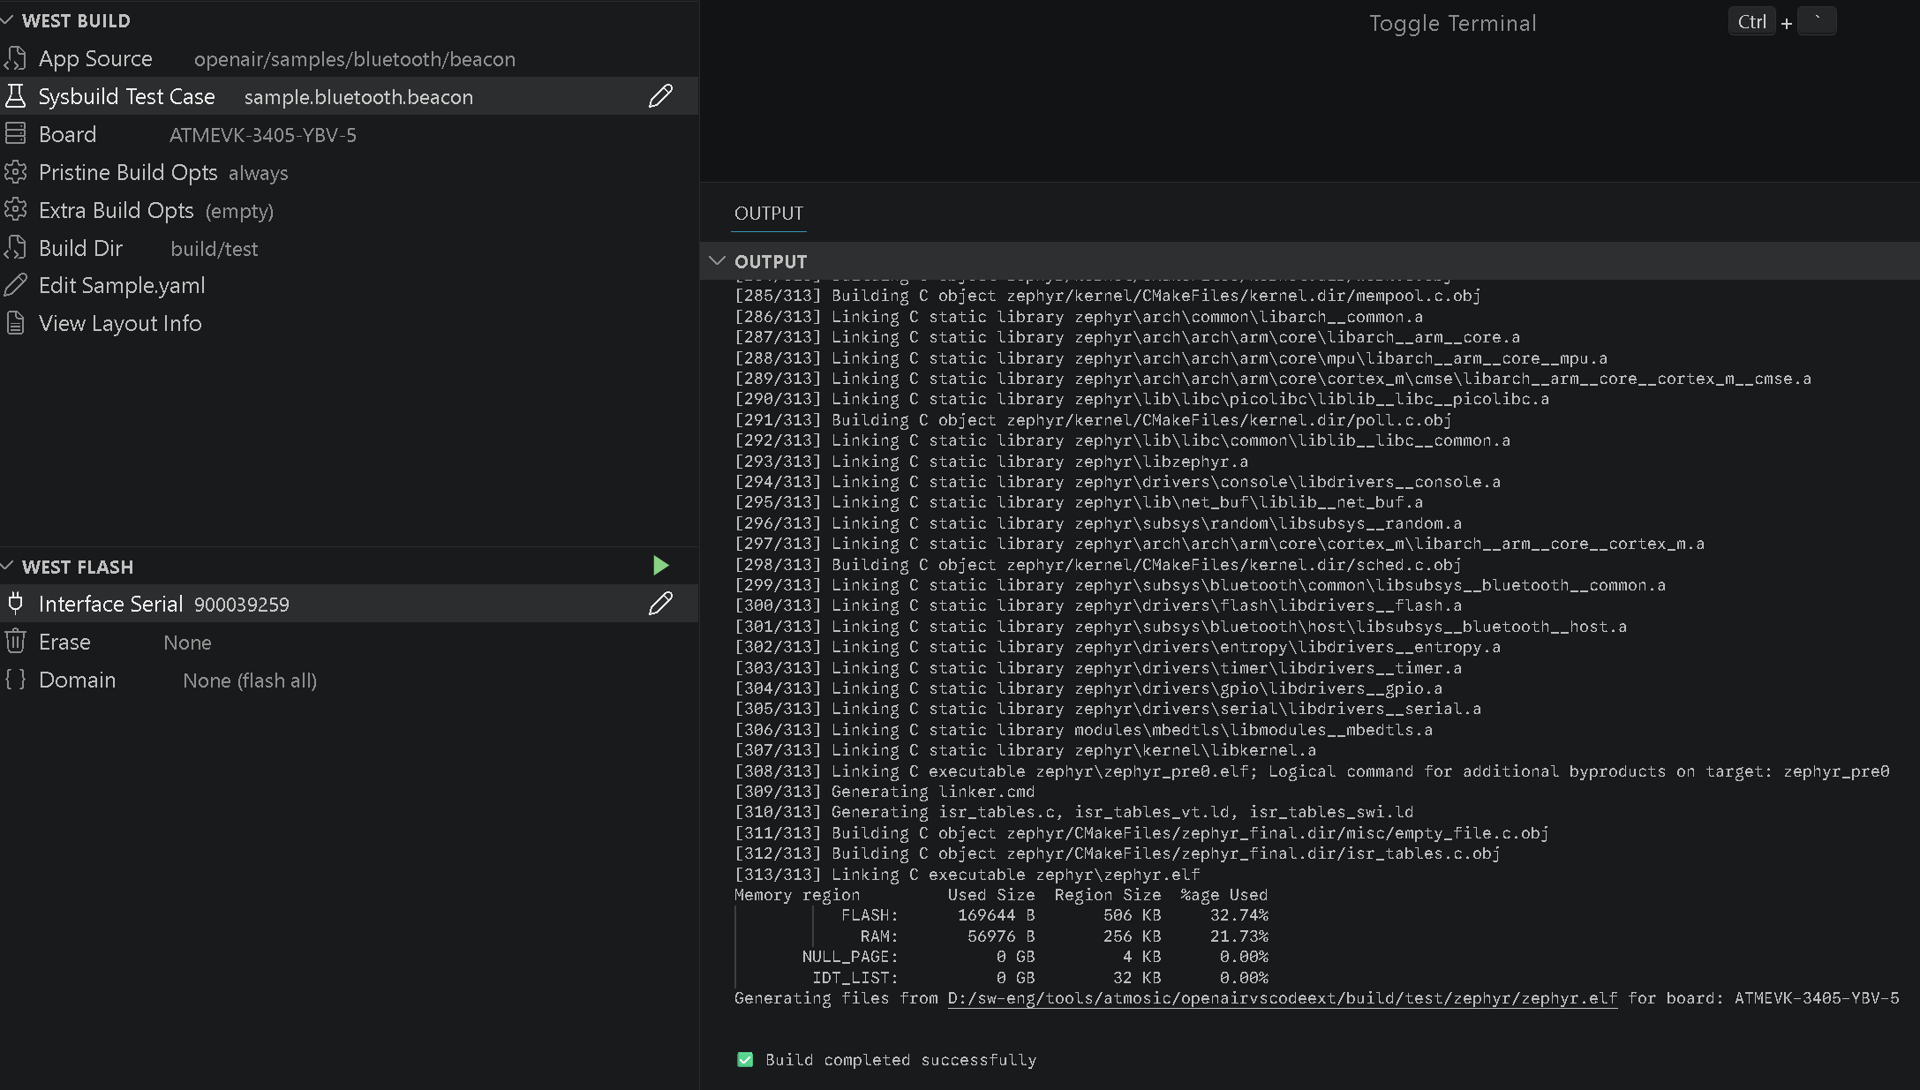
Press the upper green triangle button to start the build. The progress appears in Output view.
Flash the application to the board
1. In West Flash view, select the target serial number foreach Atmosic reference design interface auto-detected by the extension. For experienced users, you can choose which storage to erase and which application domain to program.
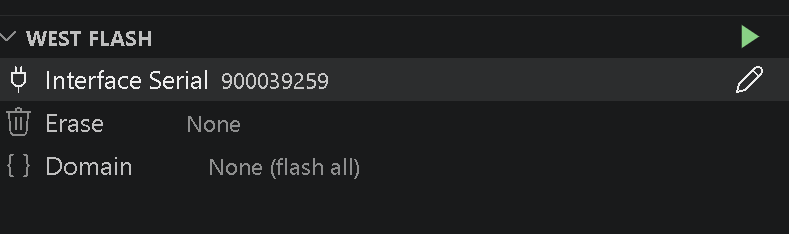
Press the upper green triangle button to start flashing. Progress appears in the Output view.
Note
Windows users new to Atmosic reference design interfaces may see a dialog asking to grant permission to install the RDI driver. Please grant to install to continue the process.
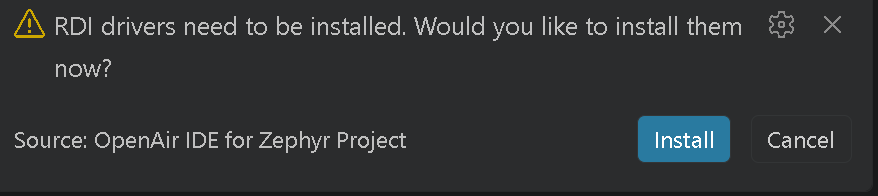
Note
After installation, switch windows using Alt+Tab and click OK on the pop-up message to continue.