See Download the extension for macOS/Windows here.
Vscode Plugin
Installation
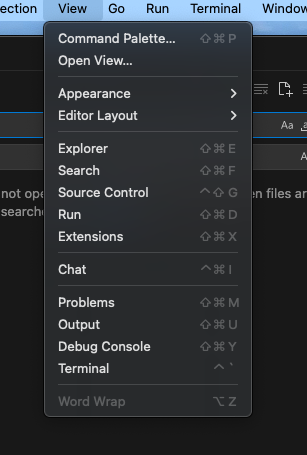
Select View->Extensions
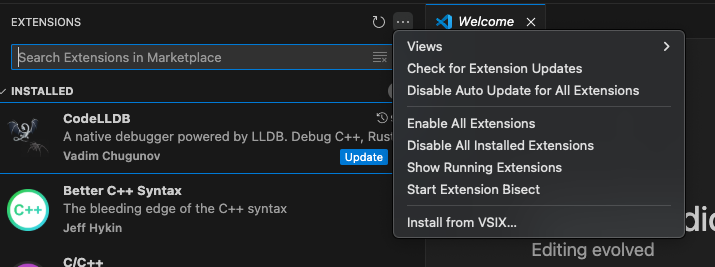
Click on 3 dots to the right and select “Install from VSIX…”
Environment Setup for New Starter
Open a folder in VS Code to use as the root workspace for the Zephyr project.
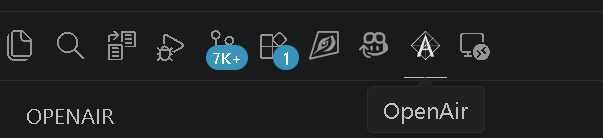
Locate the OpenAir extension in the extension view
In the Setup view, click Zephyr IDE Configuration to check the environment status
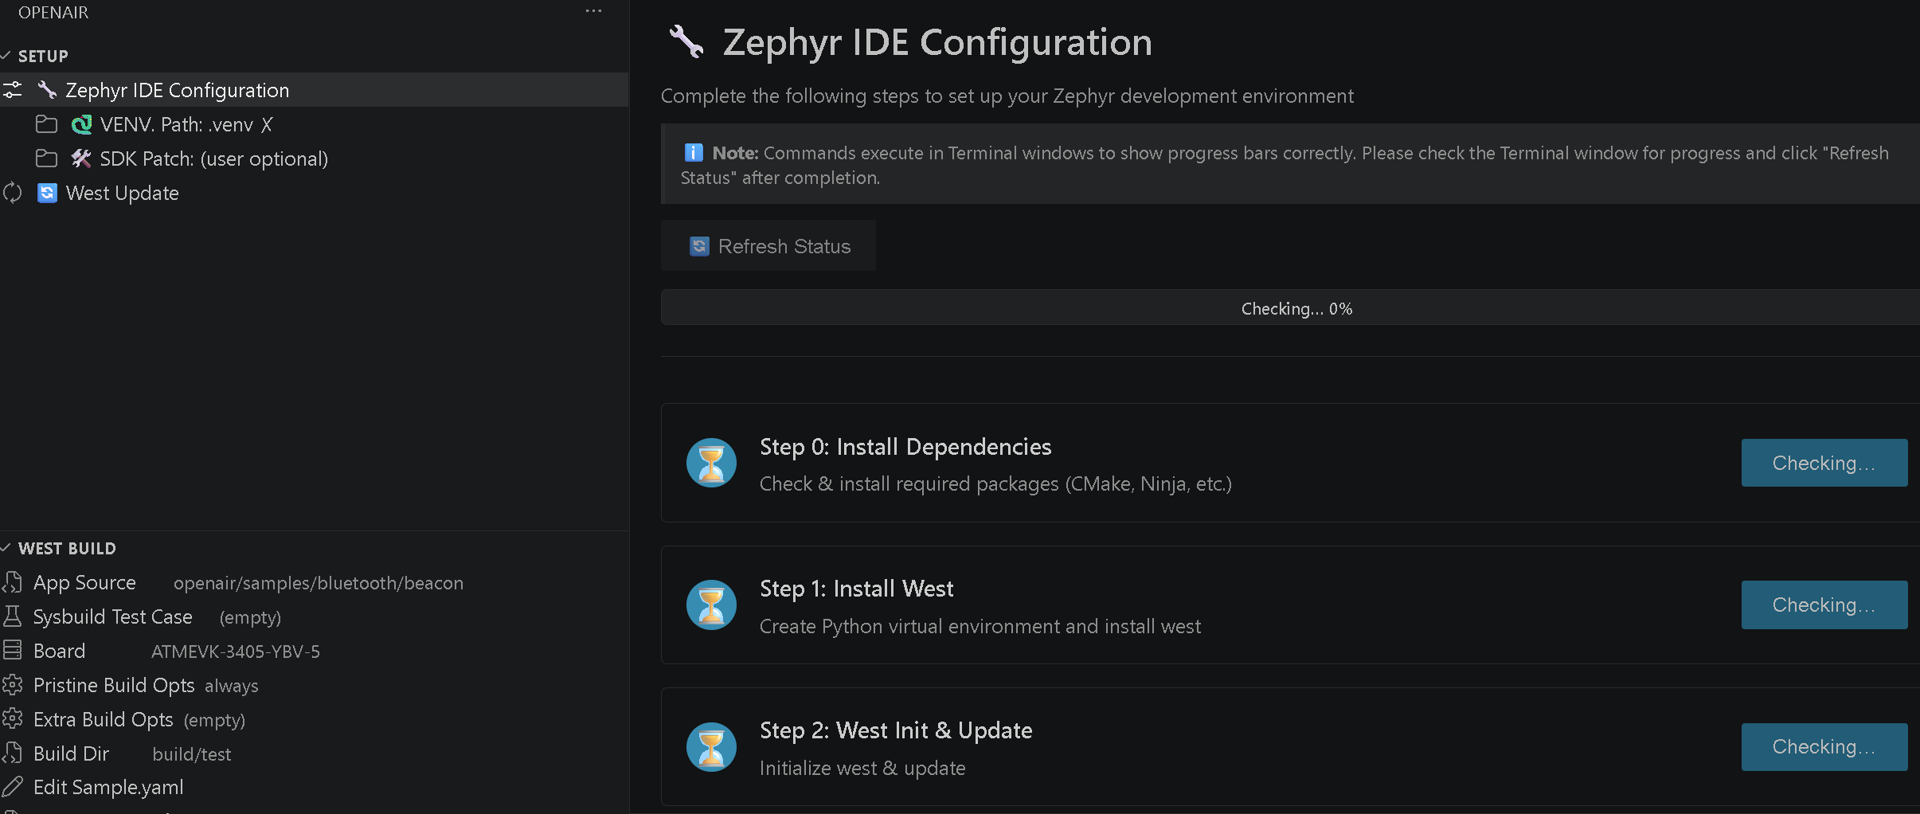
In the Zephyr IDE Configuration, follow the setup steps to prepare the environment for Zephyr development prerequisites.
Note
The time required depends on your internet quality.
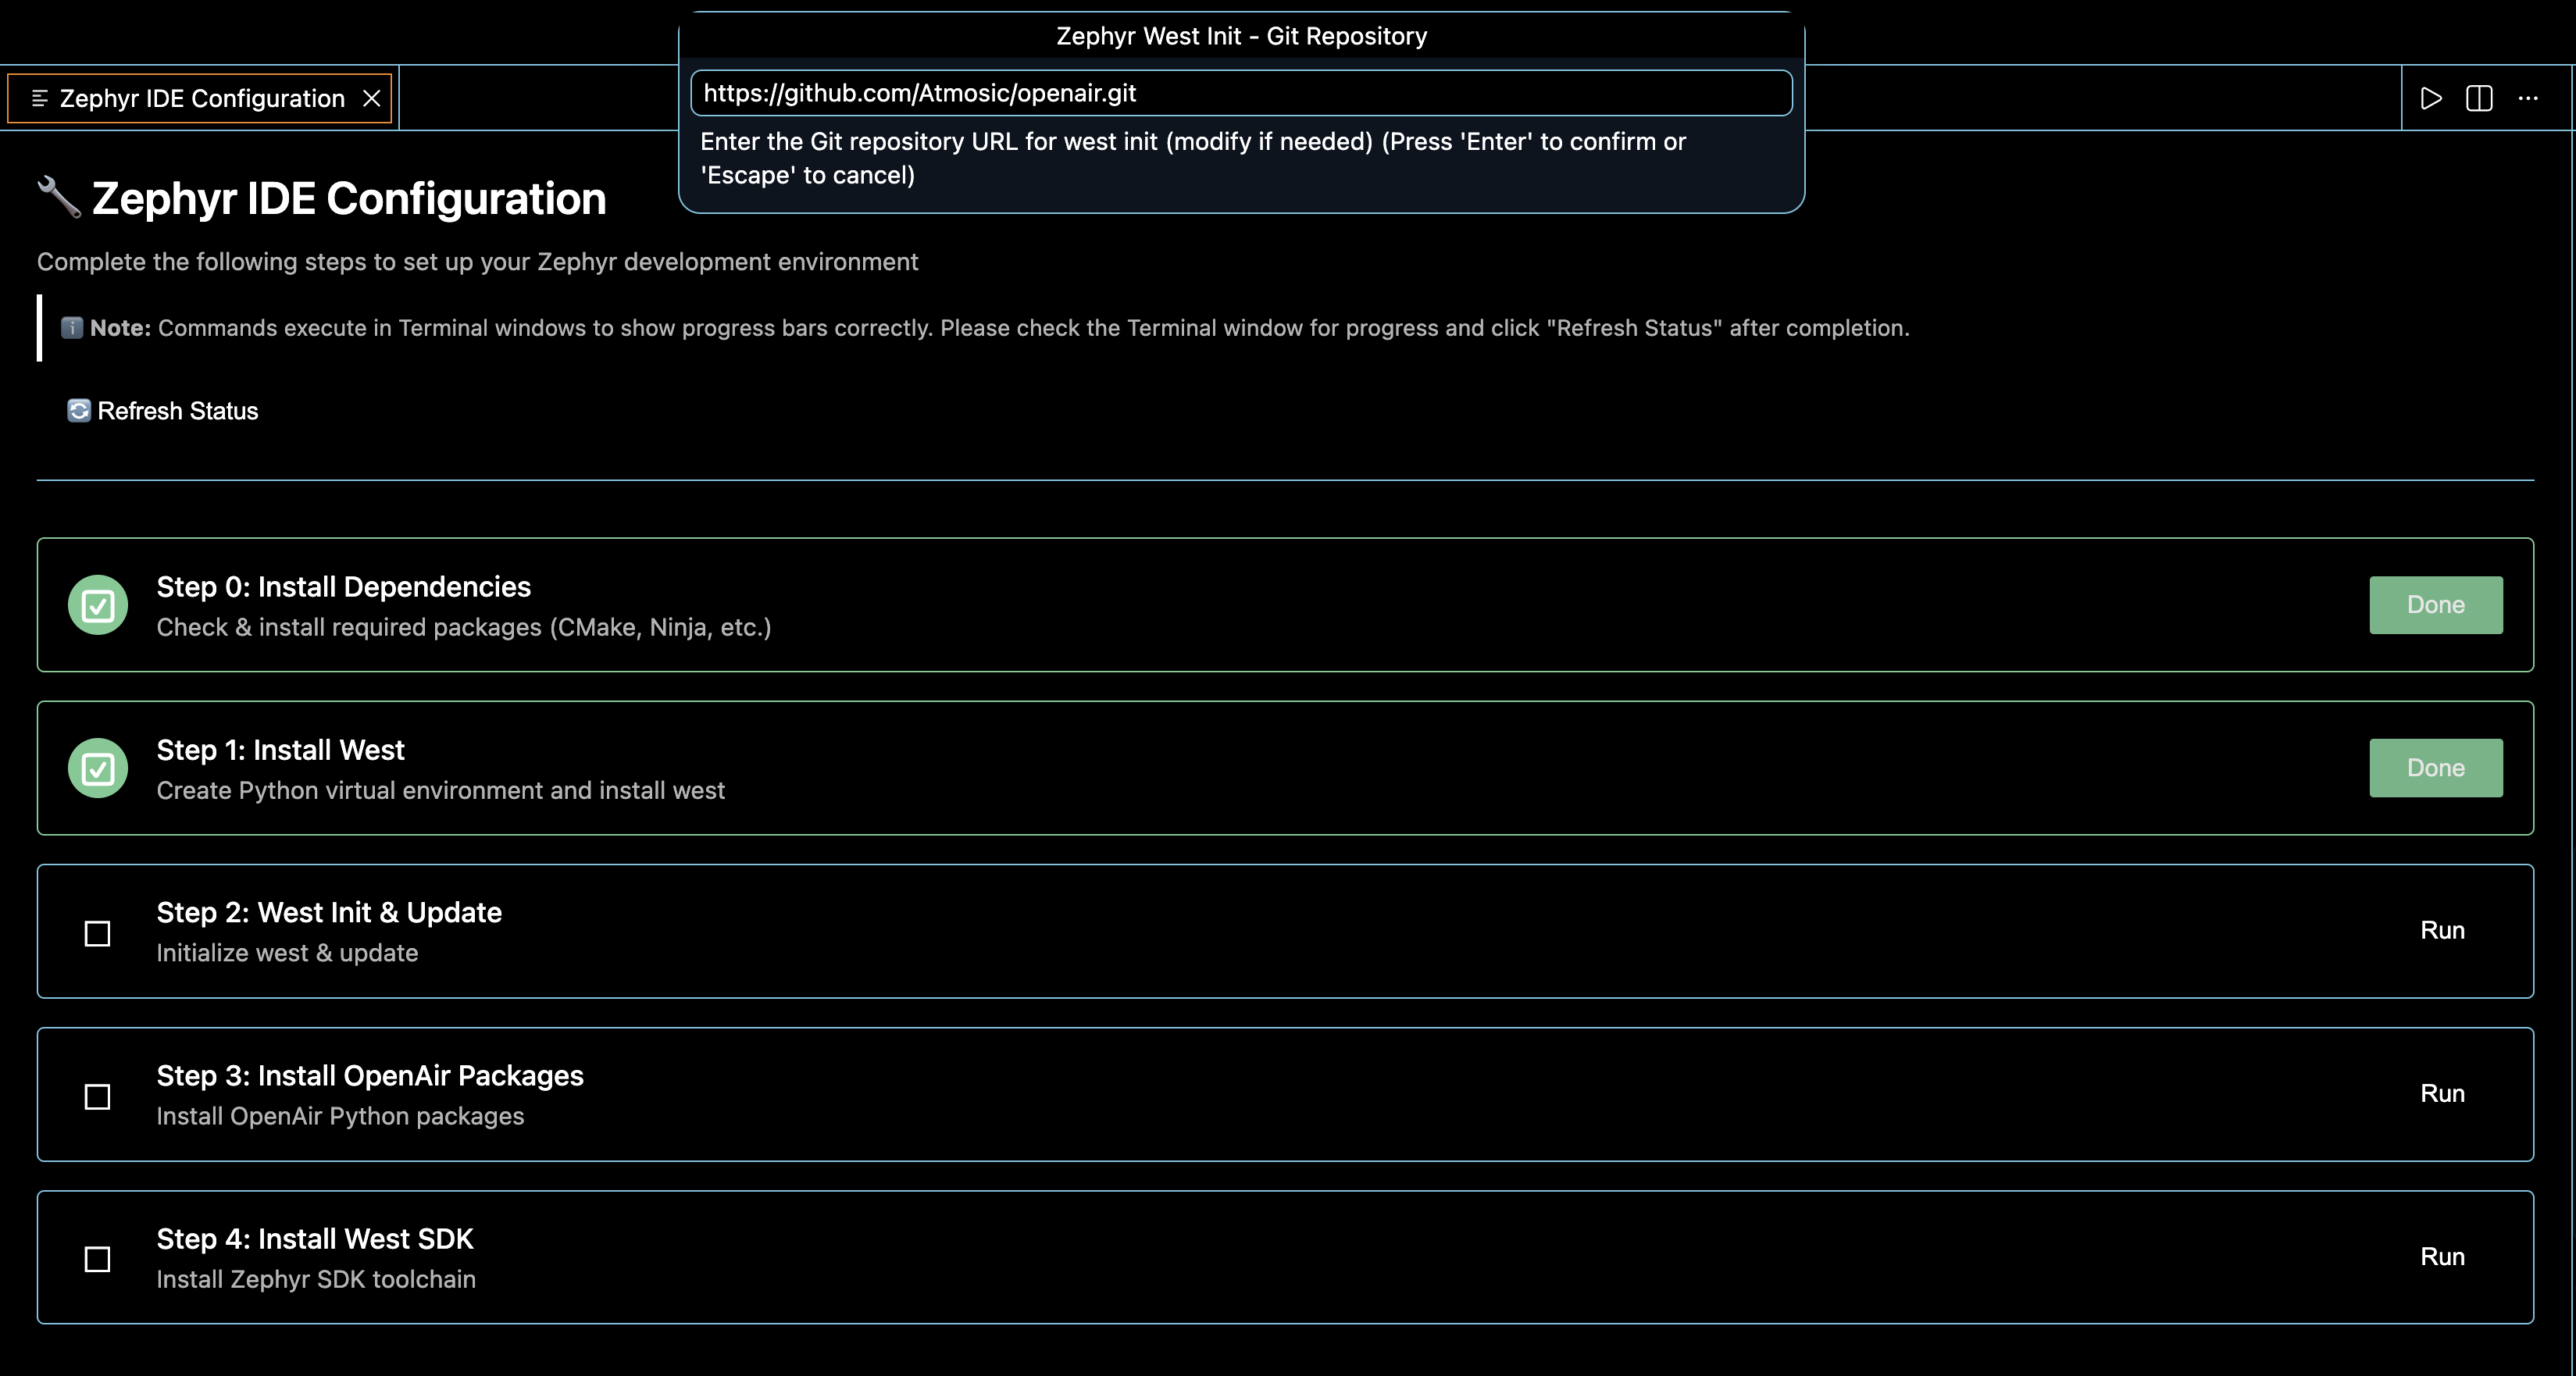
Use existing virtual environment
1. Open an existing Zephyr project workspace. You can reuse the existing virtual environment and SDK on your computer by specifying their paths in the Setup view, avoiding the need to repeat earlier steps in Zephyr IDE Configuration.
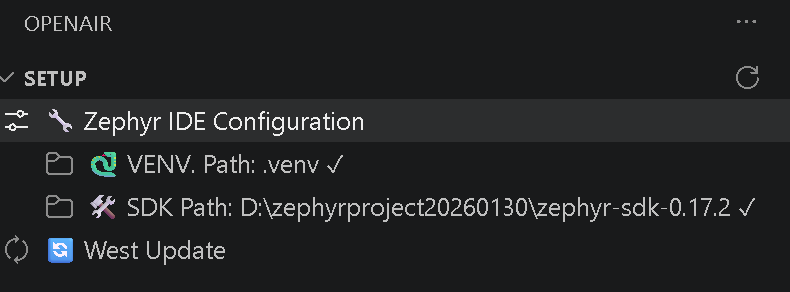
Note
The virtual environment folder must be named .venv for proper integration with the VS Code extension.
Build OpenAir applications
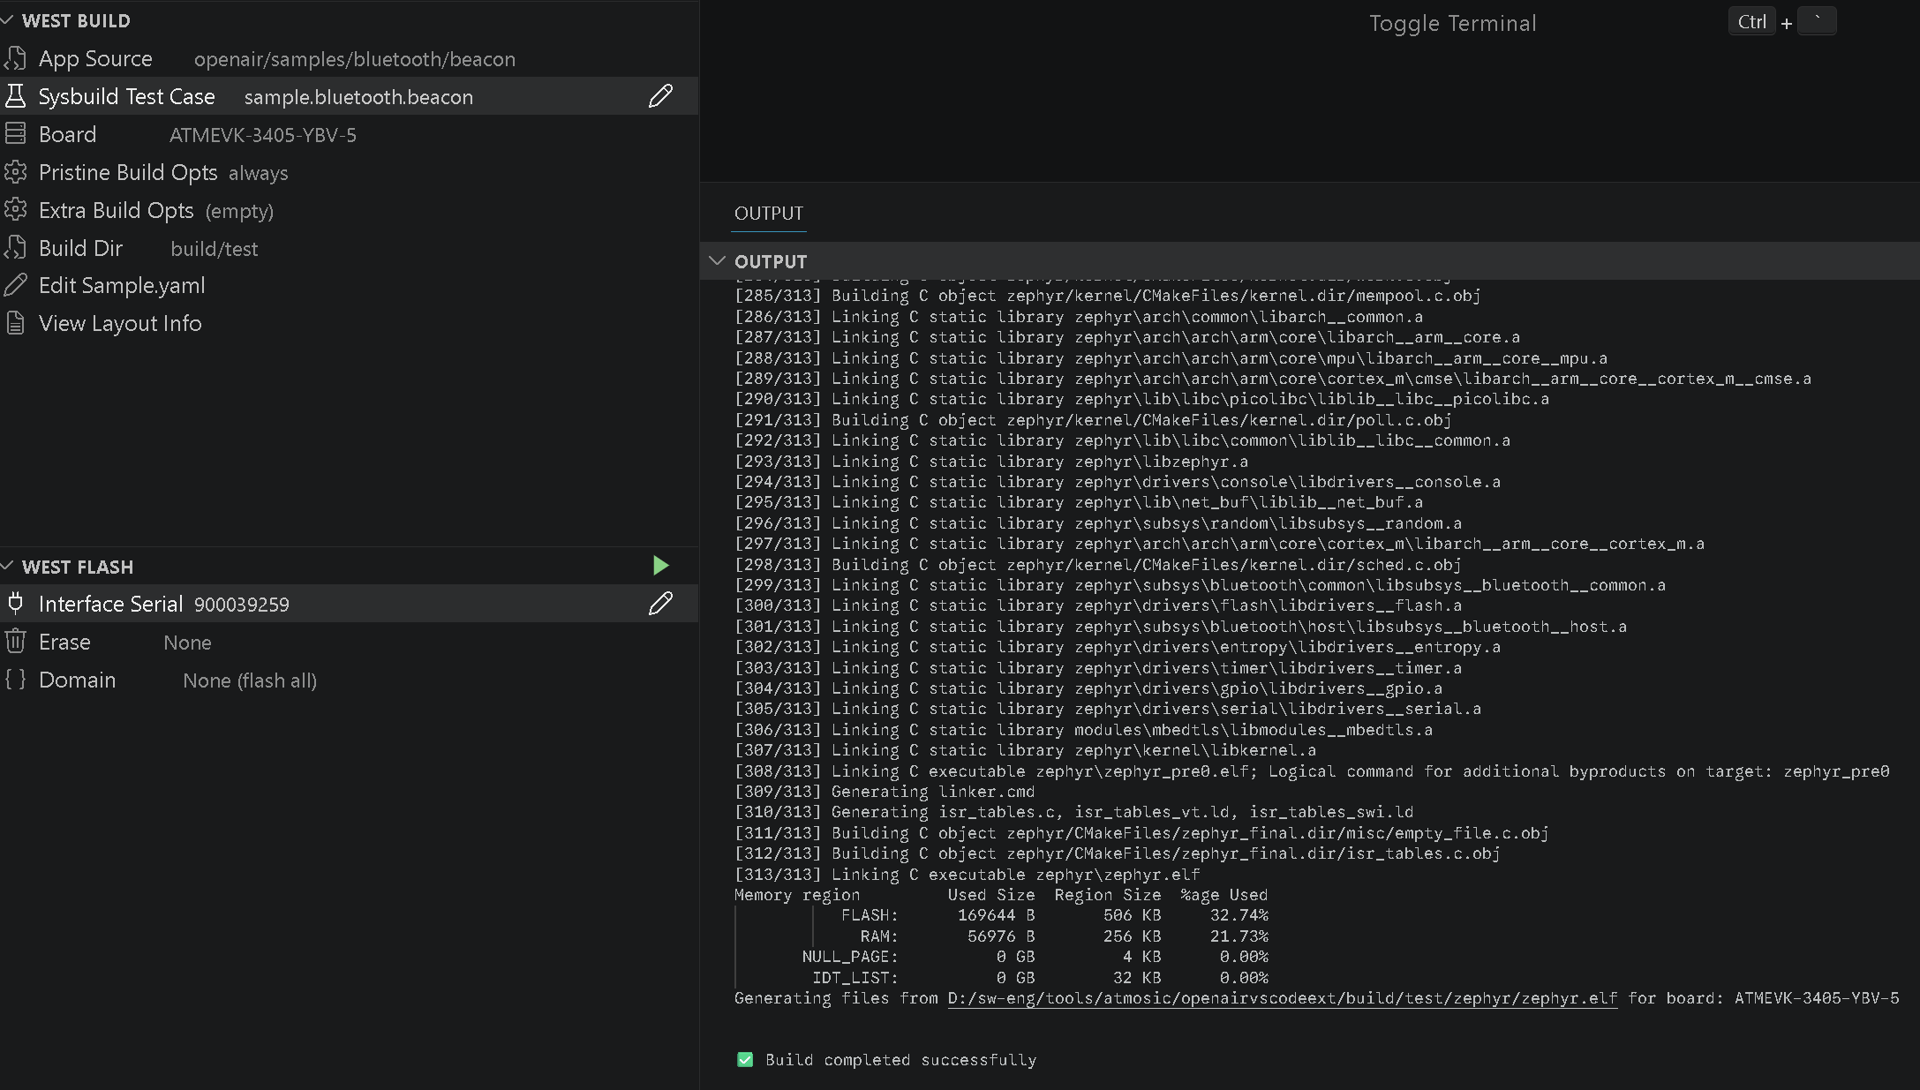
In the West Build view, select applications supported by OpenAir from “App Source”.
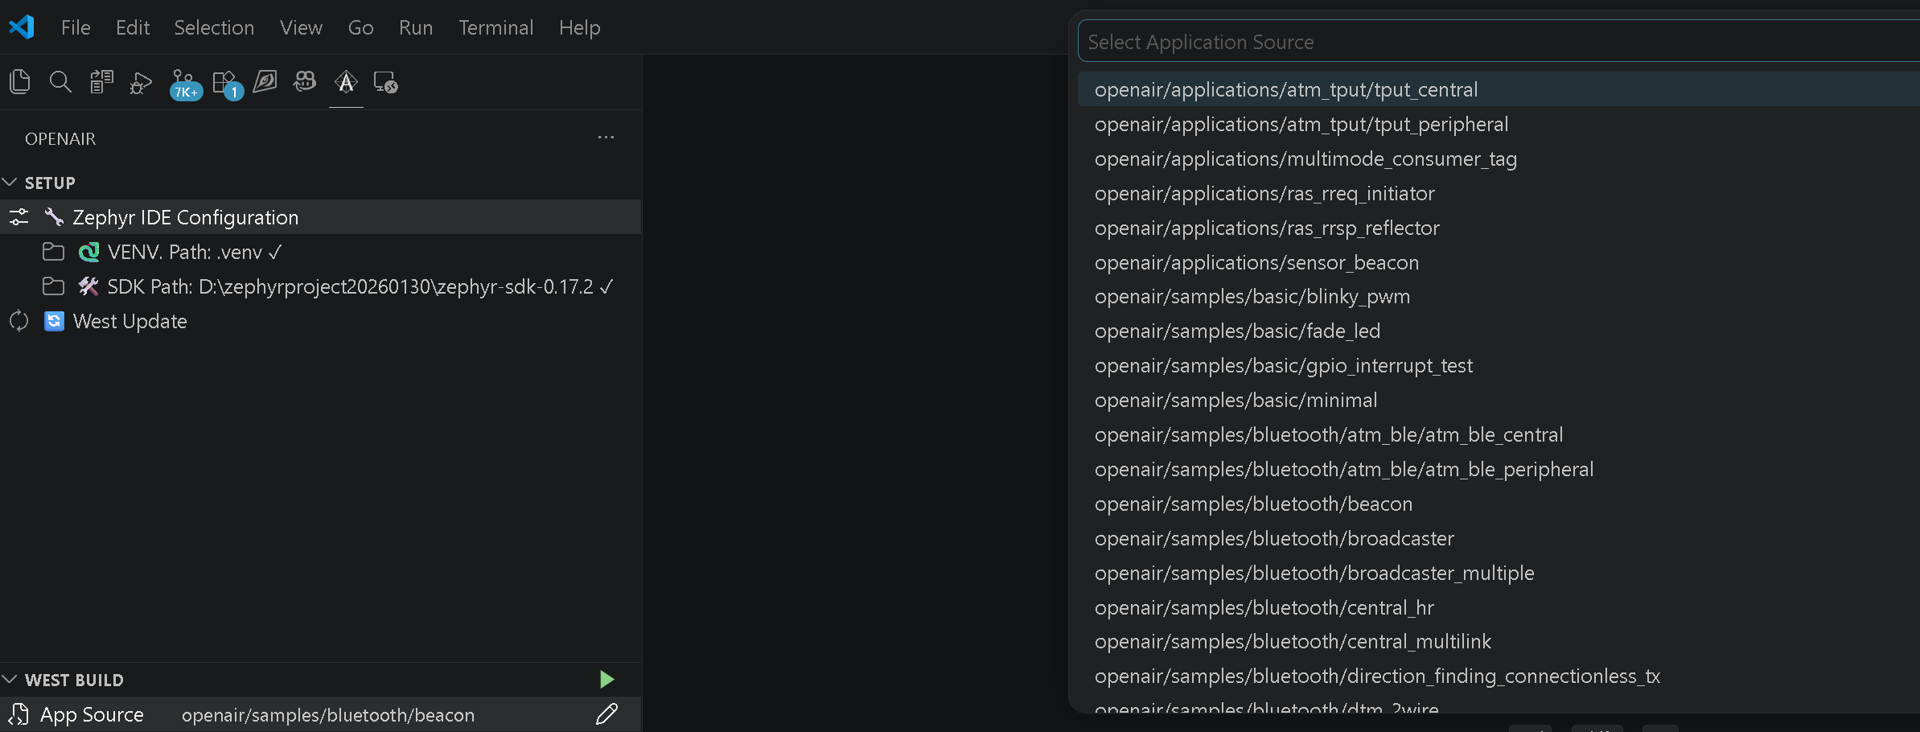
2. Choose from several predefined configurable combinations in Sysbuild Test Case. Boards are also selectable.
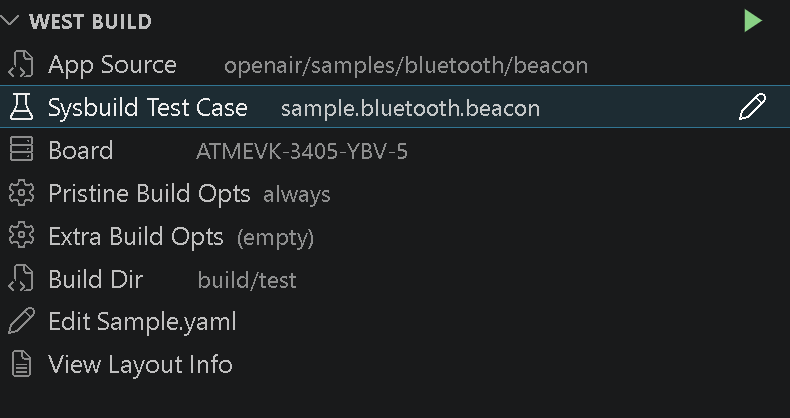
Note
For experienced users, select Pristine Build Opts defined by Zephyr and add Extra Build Opts.
Press the upper green triangle button to start the build. The progress appears in Output view.
Flash the application to the board
1. In West Flash view, select the target serial number foreach Atmosic reference design interface auto-detected by the extension. For experienced users, you can choose which storage to erase and which application domain to program.
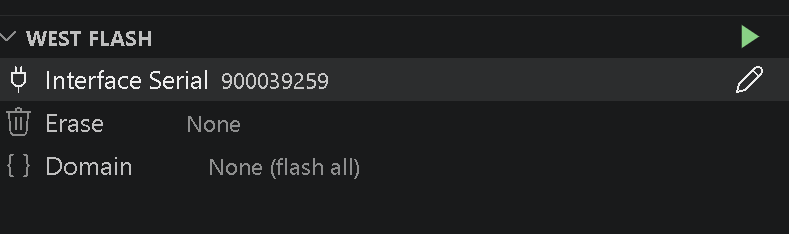
Press the upper green triangle button to start flashing. Progress appears in the Output view.
Note
Windows users new to Atmosic reference design interfaces may see a dialog asking to grant permission to install the RDI driver. Please grant to install to continue the process.
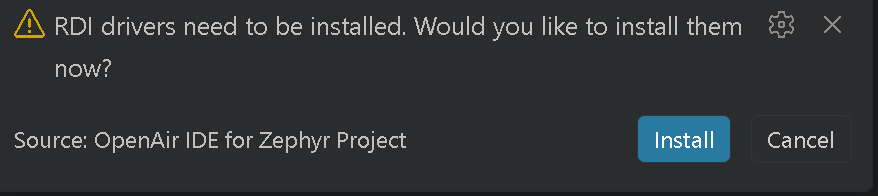
Note
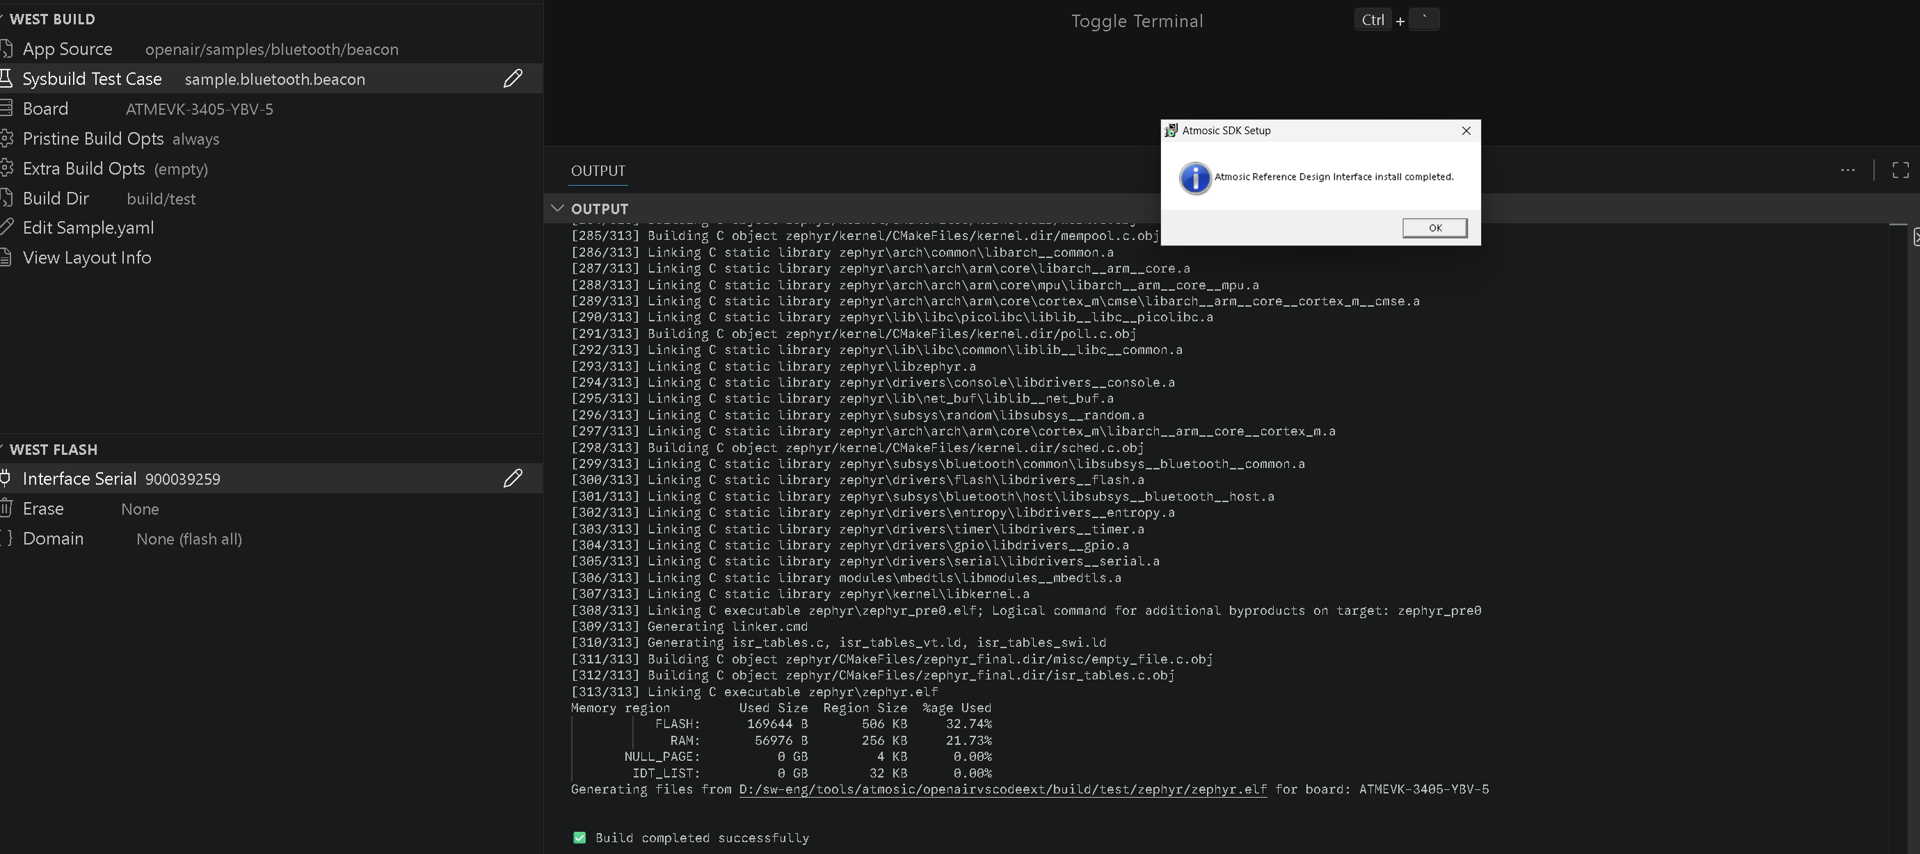
After installation, switch windows using Alt+Tab and click OK on the pop-up message to continue.
Debug the application
This section explains how to set up the debug environment and run Cortex-Debug with the OpenAir VS Code extension.
Prerequisites
Before debugging, complete the OpenAir environment setup and install the debug-related tools:
OpenAir workspace (West + Python venv + SDK) to build Zephyr applications
SEGGER J-Link (JLinkGDBServer) for on-chip debug via a J-Link probe
Cortex-Debug extension (
marus25.cortex-debug) for the VS Code debug UIA built application ELF (
zephyr.elf) as the symbol fileA J-Link probe connected to the target
1. Set up the debug environment
Open the Configuration Panel
Open your OpenAir / Zephyr workspace in VS Code.
Open the Command Palette (
Ctrl+Shift+P/Cmd+Shift+P).Run OpenAir: Open Configuration Panel.
Or use OpenAir: Start Environment Setup and choose a starting step.
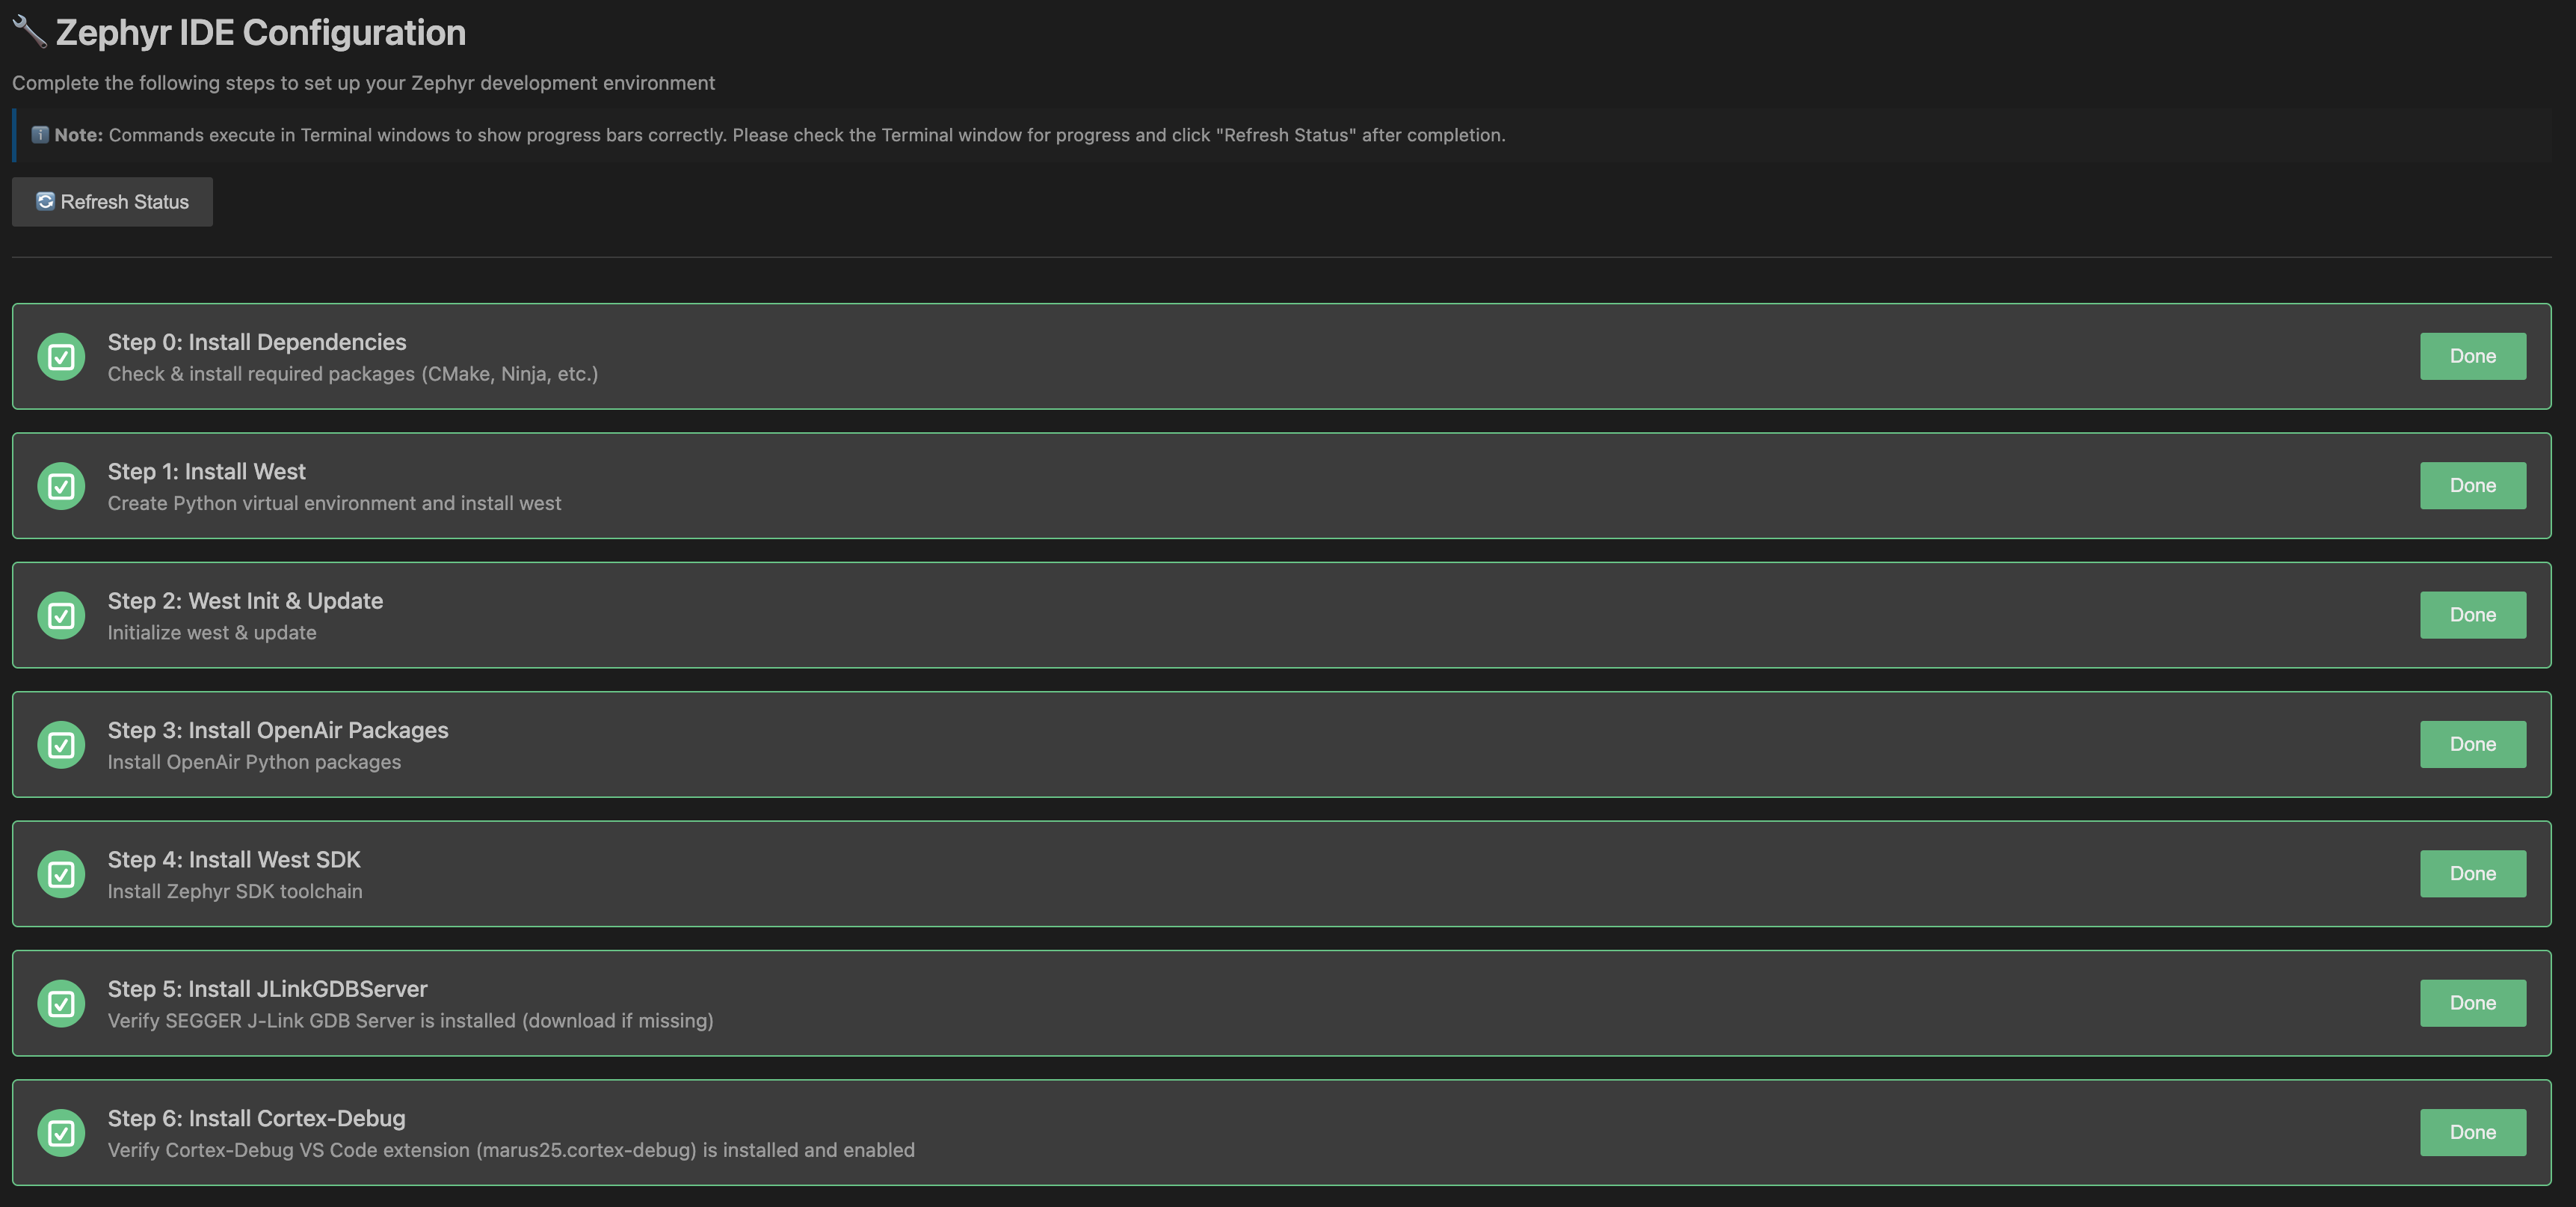
Complete the setup steps
Run or verify each step until the status shows complete. Click Refresh Status after installs finish.
Step |
What it does |
|---|---|
Step 0 |
Install system dependencies (CMake, Ninja, etc.) |
Step 1 |
Create Python venv and install West |
Step 2 |
West init & update |
Step 3 |
Install OpenAir Python packages |
Step 4 |
Install Zephyr / West SDK toolchain ( |
Step 5 |
Check JLinkGDBServer (SEGGER J-Link) |
Step 6 |
Check Cortex-Debug VS Code extension |
If JLinkGDBServer is missing:
Run OpenAir: Step 5 - Install JLinkGDBServer, or click the step in the Configuration Panel.
Choose Open Download Page.
Download and install the SEGGER J-Link software package.
Click Refresh Status in the Configuration Panel.
Note
On Windows, the extension looks under %ProgramFiles%\\SEGGER\\
(for example JLink_V8.12a\\JLinkGDBServerCL.exe) and prefers the newest
versioned install. After install, ensure JLinkGDBServer /
JLinkGDBServerCL is available on your system.
If Cortex-Debug is not installed or is disabled:
Run OpenAir: Step 6 - Install Cortex-Debug, or click the step in the Configuration Panel.
Choose Install Extension (or Open Extension Page to install manually).
If VS Code prompts you, reload the window.
Click Refresh Status in the Configuration Panel.
2. Build your application
Debugging requires a built ELF. Configure and build from the Build view in the OpenAir sidebar.
Enable Thread Monitor
Thread Monitor adds Kconfig options at build time so you can inspect thread names, monitor state, and runtime statistics while debugging.
When Enable Thread Monitor is On, the extension stores these flags in Extra Build Opts and passes them to West Build:
Flag |
Purpose |
|---|---|
|
Enable Zephyr thread monitor support |
|
Keep human-readable thread names |
|
Collect thread runtime statistics |
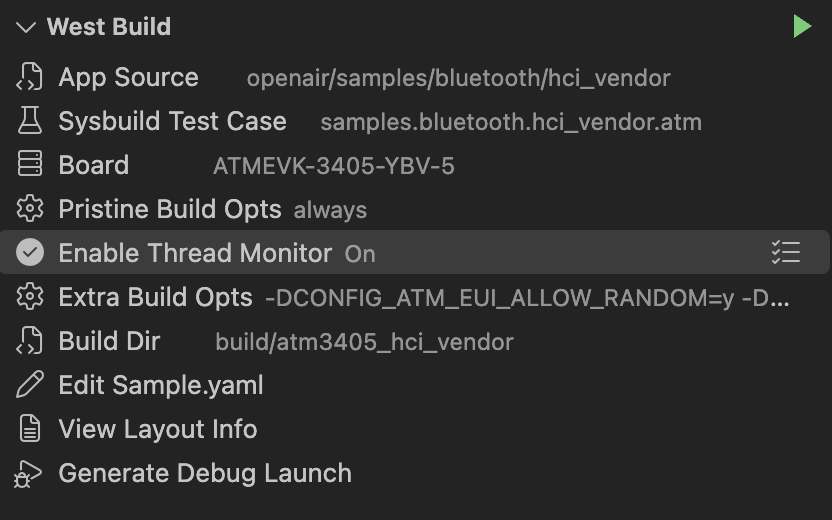
To enable or disable Thread Monitor:
Open the OpenAir sidebar and select the Build view.
Click the Enable Thread Monitor row to toggle:
On — flags are added to Extra Build Opts
Off — flags are removed
Note
Toggle Thread Monitor before you build. If you change it later, rebuild so the ELF used for debugging includes the updated Kconfig settings.
Build the application
Set Application Source (for example
openair/samples/bluetooth/hci_vendor).Set Board.
Optionally set Build Dir (default:
build).Run West Build.
Expected ELF path (sysbuild layout):
{buildDir}/{appFolder}/zephyr/zephyr.elf
Example:
build/atm3405_hci_vendor/hci_vendor/zephyr/zephyr.elf
3. Generate the debug launch configuration
After a successful build (and with the SDK path known):
Open the OpenAir Build view in the sidebar.
Click Generate Debug Launch (debug icon), or run OpenAir: Generate Debug Launch Config from the Command Palette.
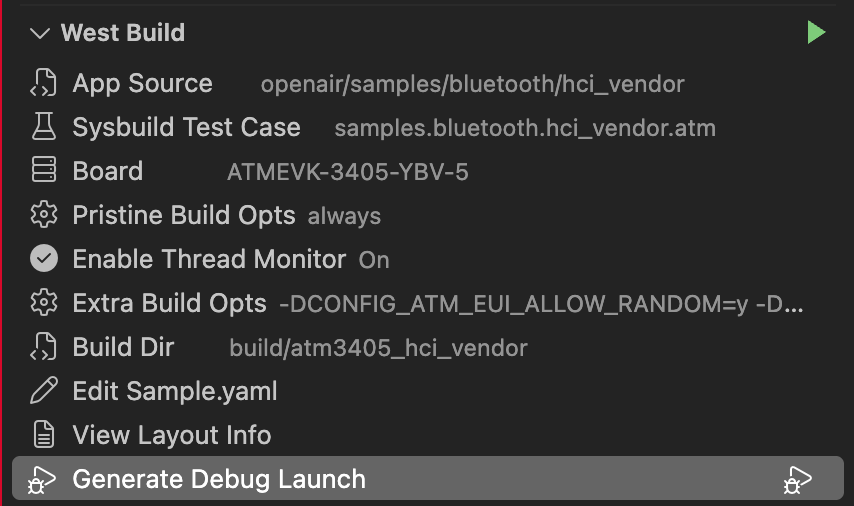
The extension writes or updates .vscode/launch.json with a configuration
named OpenAir Debug.
Note
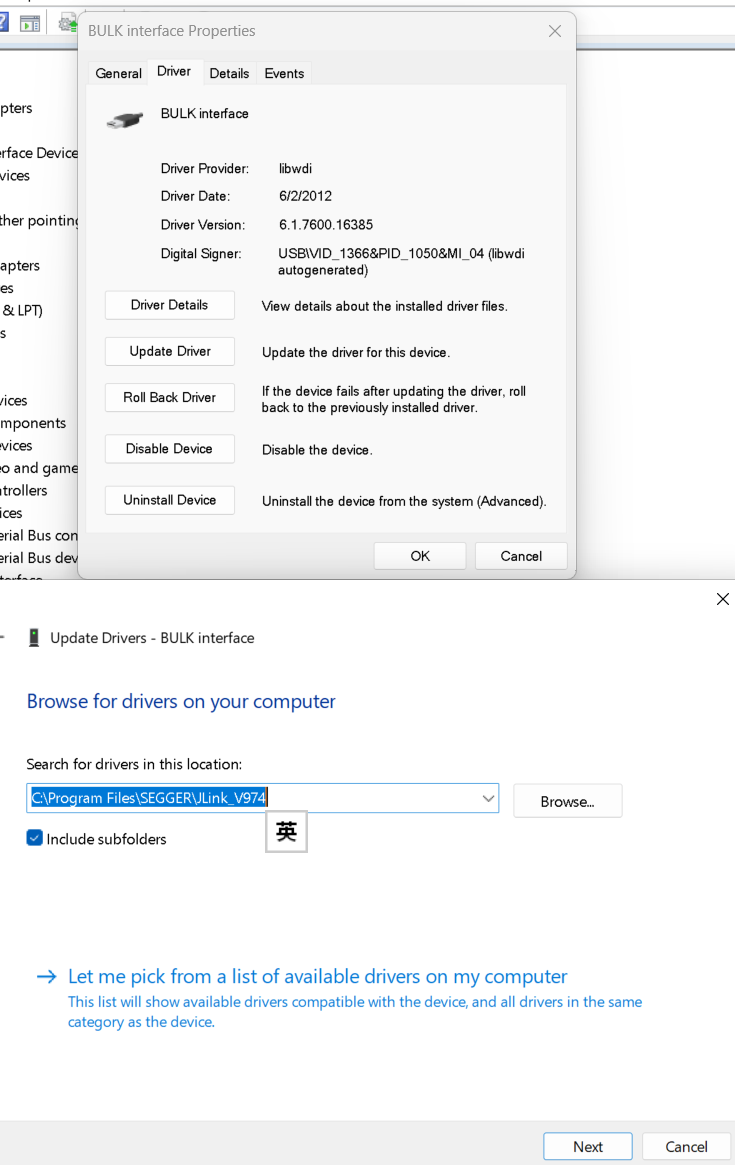
Windows users need to manually change the driver of Atmosic reference design interface to jlink driver before debugging. Go to Device Manager, expand the category “Universal Serial Bus devices” and look for “BULK interface”. Right click and select “Update Driver”. Choose “Browse my computer for driver software” and select “Let me pick from a list of device drivers on my computer”. Then select the “SEGGER J-Link” from the list. Or select “Search for drivers in this location” and browse to the SEGGER driver folder.
The following screenshots illustrate the driver update steps:
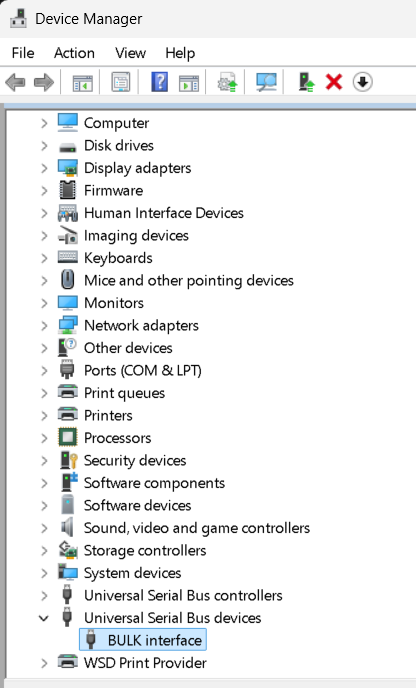
Device Manager: locate “BULK interface” under “Universal Serial Bus devices”.
Update Driver dialog: select “SEGGER J-Link” from the driver list.
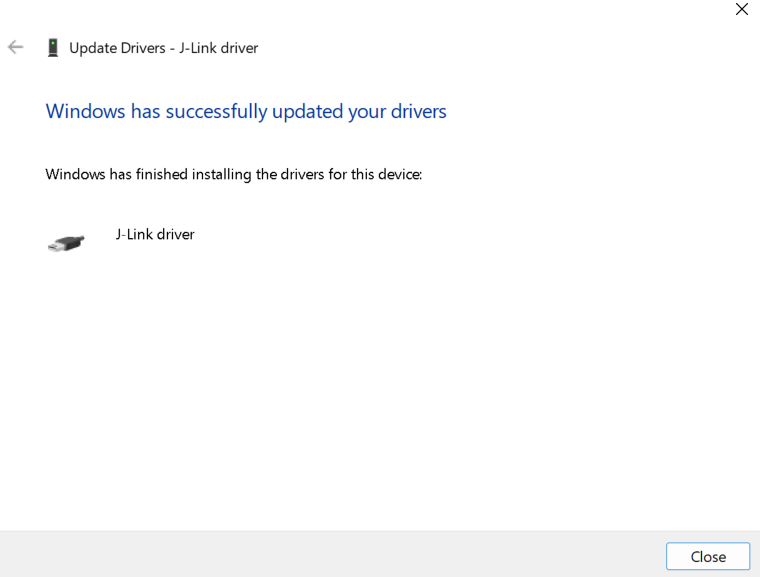
Confirmation that the J-Link driver was installed successfully.
Note
If the ELF is missing, the configuration is still written, but you must build first before starting debug. If the SDK / GDB path is not found, fix Step 4 or set the Zephyr SDK path (Set Zephyr SDK Path).
4. Run the debug session
After you build and re-flash the application to the board (see Flash the application to the board above), start a debug session as follows:
Connect the J-Link probe to the target board and to the PC.
Power the board.
Open the VS Code Run and Debug view (
Ctrl+Shift+D/Cmd+Shift+D).

Select OpenAir Debug in the configuration dropdown.
Press Start Debugging (
F5).
Cortex-Debug starts the J-Link GDB server, loads symbols from the ELF, and
stops at main (or continues according to your breakpoints).
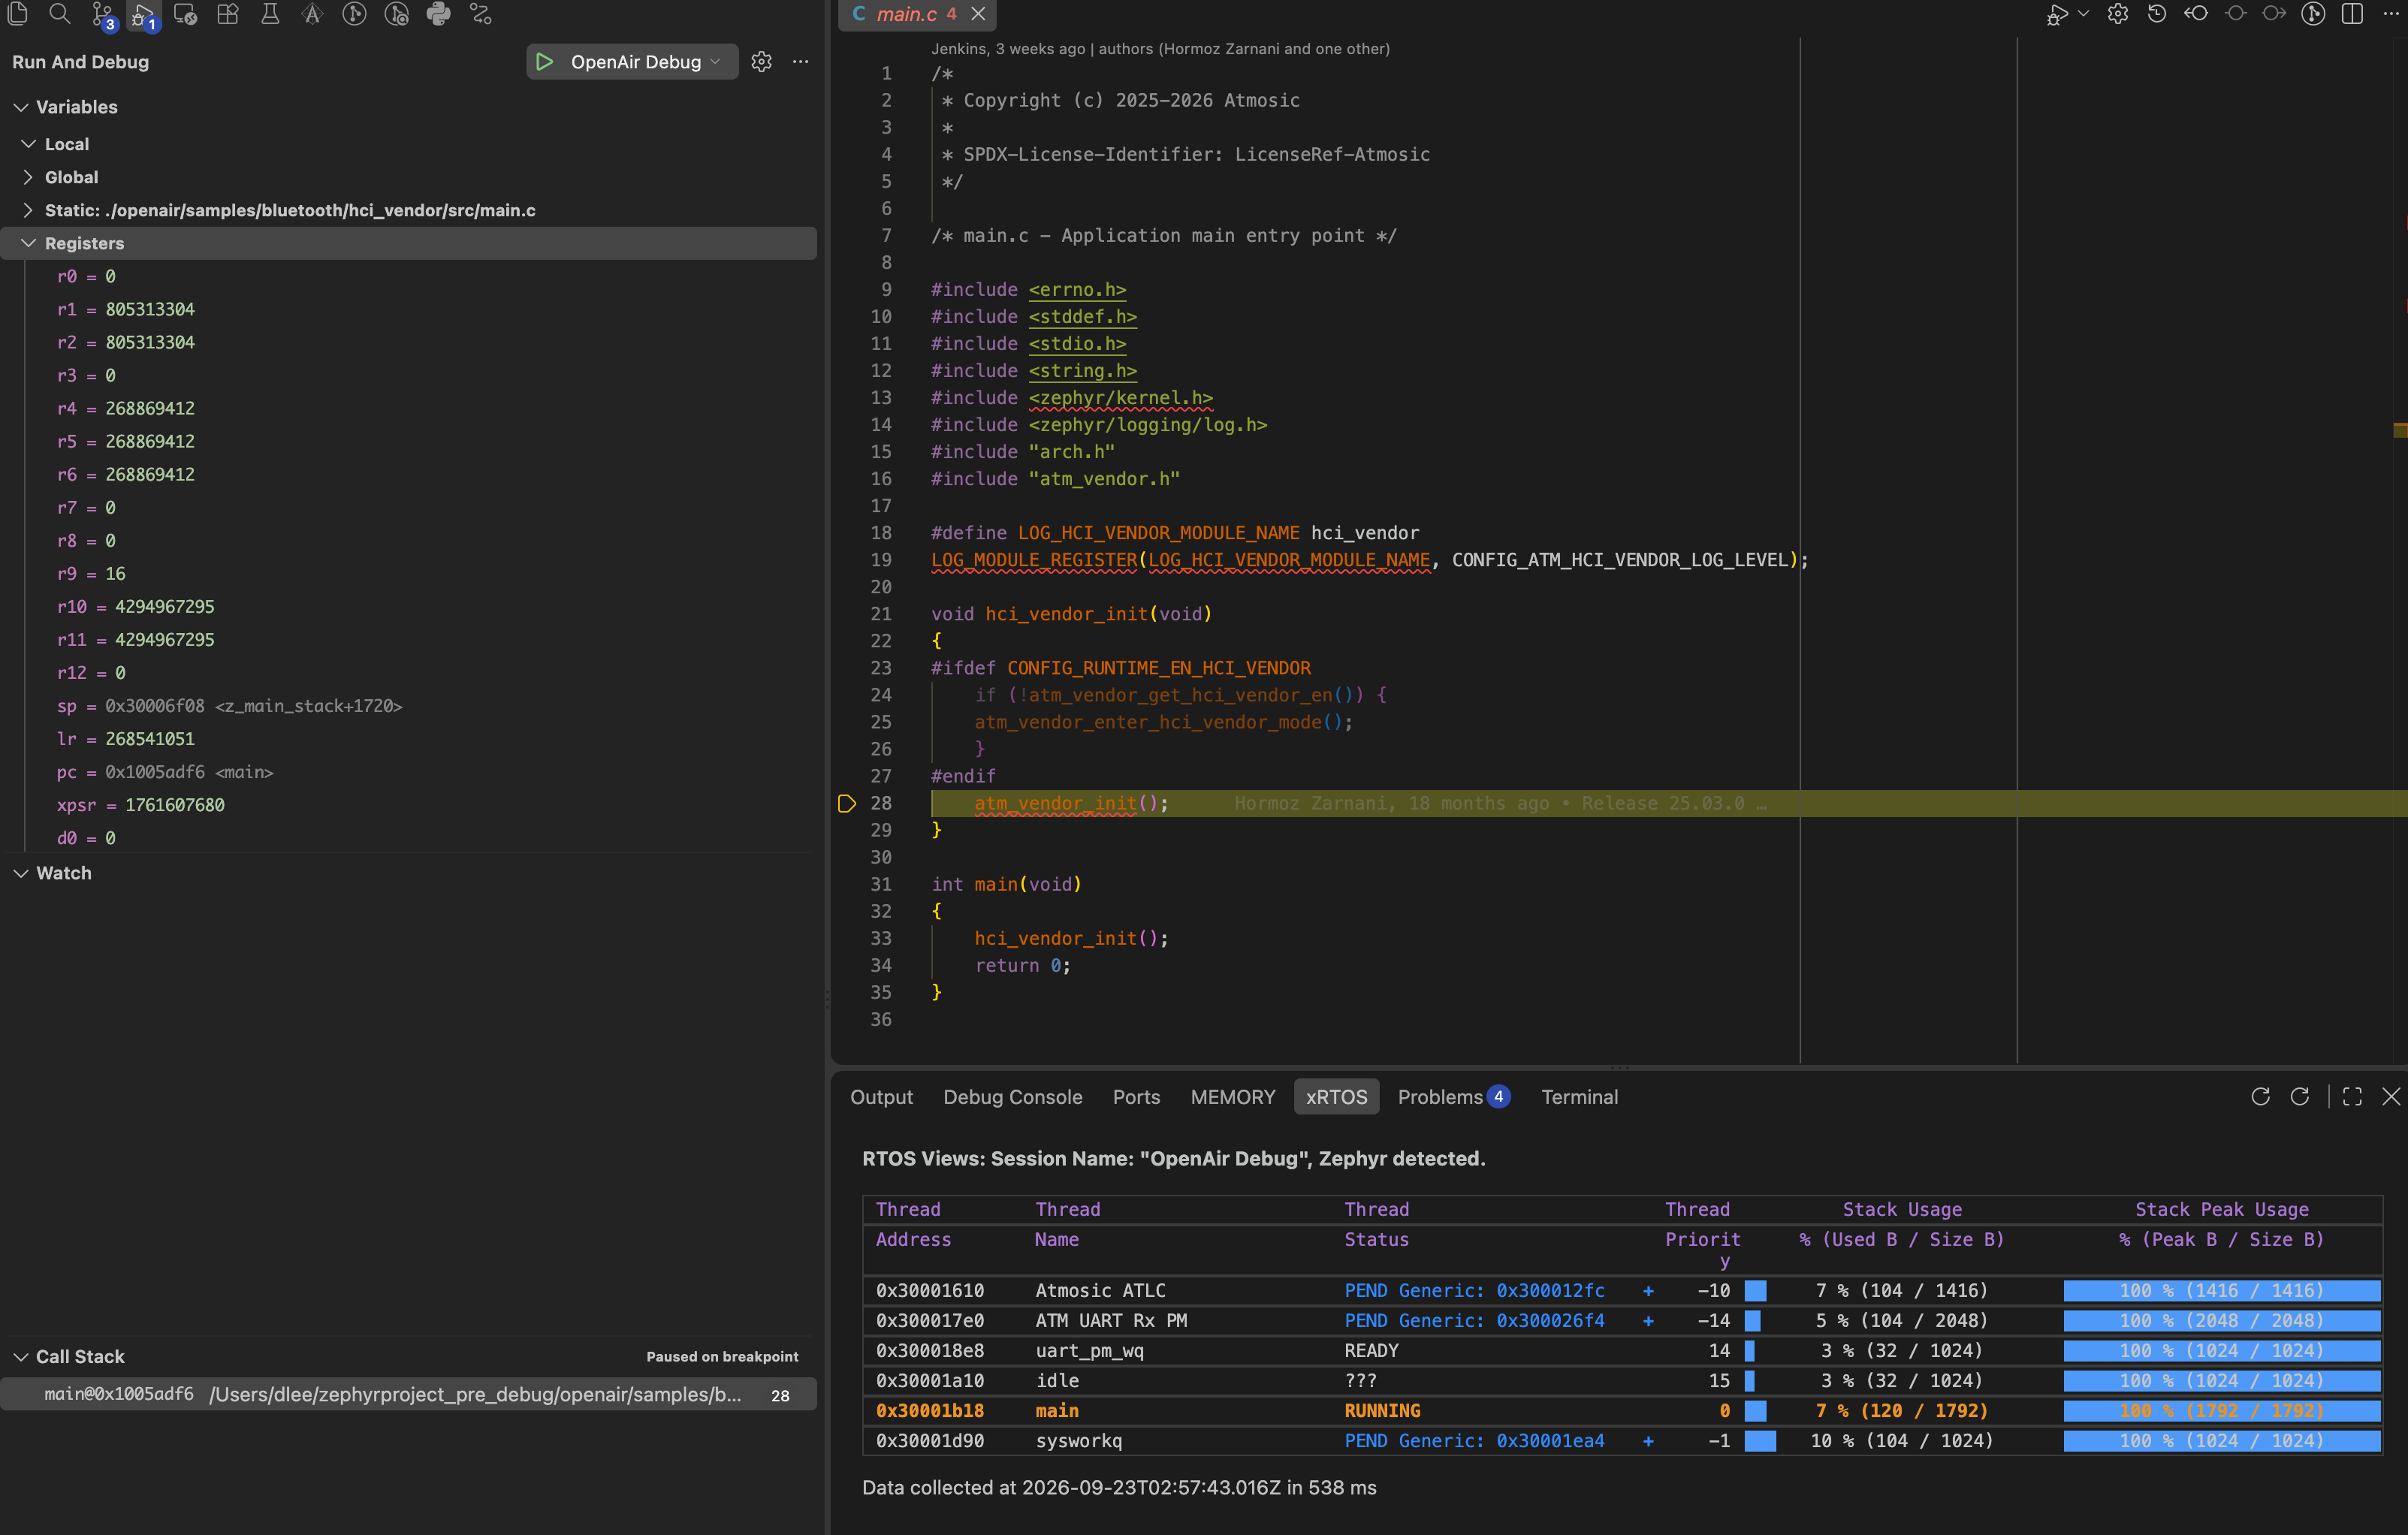
Debug and Thread Monitor views
While the session is running, use these VS Code views together:
Run and Debug — breakpoints, call stack, variables, watches, and the usual step / continue controls from Cortex-Debug.
xRTOS — Zephyr thread monitor data (thread names, state, and runtime statistics) when Thread Monitor was enabled at build time.
Switch between Run and Debug and xRTOS in the activity bar as needed during the session.
Note
Always flash the same build you generate the launch configuration from. If you rebuild or change Thread Monitor settings, re-flash before starting a new debug session so the target matches the ELF.